Service Request Management
Service requests are the most frequent interaction touchpoint between IT departments and business users. Behind every fault report, repair, and inquiry is a real collaboration process within the organization. Process and collaboration capabilities must be powerful enough to fit actual usage scenarios—answering calls, handling on-site visits, managing suppliers, and calculating data. NI-System v7.0's Service Request module centers on core scenarios such as intake, on-site visits, self-service reporting, supplier collaboration, and process closed-loop, embedding standard processes into the system so that the entire service process is traceable, workload is quantifiable, and service quality is evaluable.
Multi-Channel Intake & Smart Entry
The service desk is the first touchpoint between the IT department and business users. Timely intake, accurate ticket recording, and quick assignment directly affect the service experience of business users. Through multi-channel access and smart entry capabilities, the system lowers the intake threshold and ensures data is standardized and trustworthy from the source.
- Call Recording to Text: The system automatically converts incoming fault report recordings to text, which is directly included when creating a ticket. Colleagues taking over after reassignment can grasp the full situation by scanning the text, no need to repeatedly listen to recordings
- Quick Notes + Suggestive Tags: Record a few keywords during intake, the system auto-suggests relevant tags. After selecting a tag, preset business system, process path, symptom library, solution library, cause library, and SLA timelines are auto-filled, turning "form filling" into "form selecting"
- Automatic Caller ID Recognition: Integrates with HR systems for personnel info and business systems for department info, automatically matching the business department and user on incoming calls, auto-filling user info into tickets
- Detect Existing Department Tickets: Automatically lists whether the business department has open tickets, effectively preventing repeated reporting and duplicate assignment of the same issue, avoiding counting one task as multiple tickets
Process Engine & Closed-Loop Management
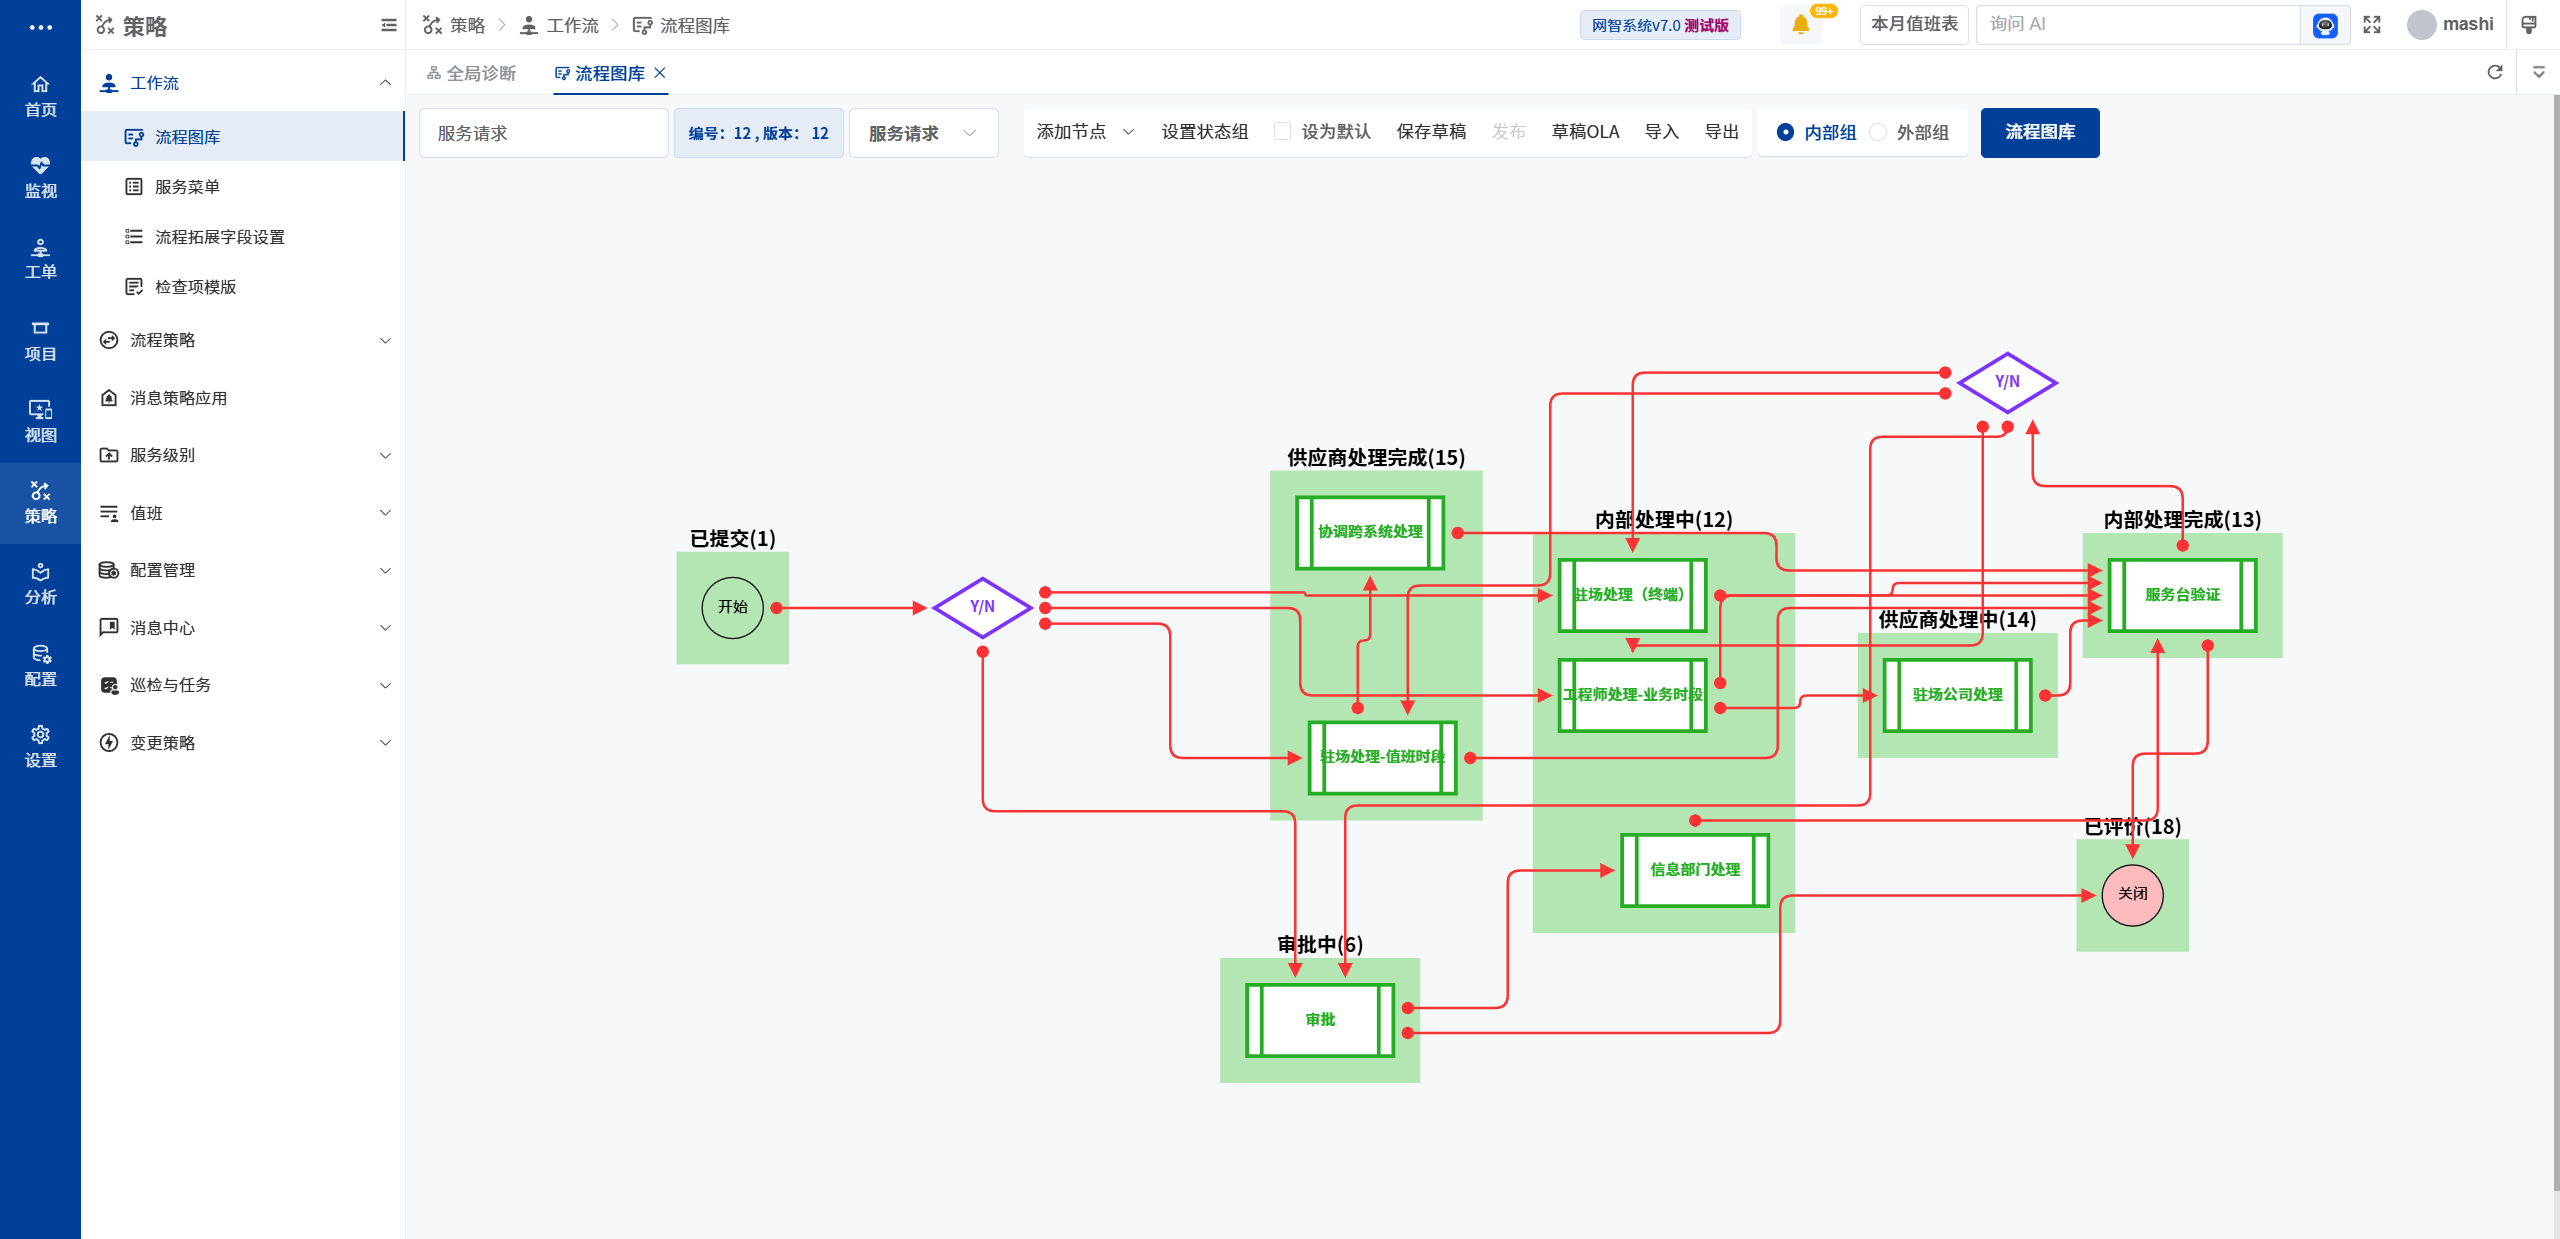
The core value of service requests is not simply recording a ticket, but embedding standard paths through the process engine, ensuring every request starts from the service desk and returns to the service desk for review, forming both management and user closed loops.
- Process Engine Embeds Closed Loop: Standardized ticket paths from opening to closing are driven by the process engine, with clear ownership at each step, reducing lost and missed tickets
- SLA Time Management: Sets response and resolution timelines by request type and priority, with automatic alerts and escalation on timeout, ensuring service commitments
- Non-Business Hours Path: Automatically determines based on ticket creation time, routing non-business-hours tickets to the on-duty path, so urgent issues are not delayed outside working hours
- Auto-Push Evaluation on Ticket Close: Automatically pushes evaluation notifications via WeCom or DingTalk when tickets close, forming a complete closed loop of reporting, handling, and evaluation
On-Site Service & Mobile Collaboration
After assignment, engineers are often not at their computers but on the way to the next site. Mobile collaboration lets engineers grasp the full ticket picture en route, saving time for actual repairs.
- Report Location on Mobile: When engineers open tickets on mobile, the system automatically shows the reporter's location (campus, building, department), no need to call and ask for directions
- Photo, Audio, and Common Address Reporting: Business users can take photos and record fault symptoms via mobile, auto-attached to tickets. Supports adding and modifying common addresses for one-click selection during reporting
- Common Address Add & Modify: For departments with complex layouts, users can update accurate location info anytime, so engineers always find people quickly without wasted trips
Supplier Collaboration & Off-Site Repair Management
Devices sent out for repair, how long until they return, whether vendors honor promised repair times—these steps take up most of ticket handling time but often lack effective monitoring. The system creates a dedicated "off-site repair" step in the process for quantified management of supplier collaboration.
- Off-Site Repair Segmented Timing: Automatically records device departure and return times, calculating total off-site repair duration
- Automatic Timeout Alerts: Uses vendor-promised repair duration as threshold, auto-alerts on timeout, making supplier repair efficiency quantifiable and monitorable
- Supplier Assessment Data: Statistics of ticket volume, on-time resolution rate, and off-site repair duration by supplier, providing objective data for supplier evaluation
Data Operations System
The primary value of data lies in statistical analysis. By quantifying the current state of IT services through statistics, anomalies and problems are identified, driving continuous improvement of work quality and efficiency. The system performs statistical analysis across six metrics and four dimensions.
Six Measurement Metrics
- Ticket Volume: Reflects trends in business demand; a surge may indicate a system problem, a drop may indicate a reporting channel failure
- Resolution Rate: Measures overall handling capability, the ratio of resolved tickets to total tickets
- Backlog: Lists all open tickets and analyzes backlog causes—waiting for business department cooperation, waiting for vendor handling, technical difficulty, or process bottlenecks
- On-Time Resolution Rate: Quantifies IT department's ability to fulfill business commitments, how many agreed timelines were met
- Average Resolution Time: Measures efficiency changes—getting faster or slower, overall slowdown or specific ticket type slowdown
- Satisfaction: User-centric discovery of service shortcomings; negative tickets analyzed for which ticket, what was unsatisfactory, and whether follow-up and remediation were done
Four Dimensional Perspectives
- By Business Department: Which department reports the most, has the worst experience
- By Business System: Which system is least stable, has the highest failure rate
- By Internal IT Group: Workload and ticket distribution across professional teams
- By Supplier: Ticket volume, on-time resolution rate, and off-site repair duration for each supplier
The four dimensions cross-combined with the six metrics form a complete data analysis matrix, supporting the transition from experience-based management to data-driven operations.