Unified Monitoring & Alerting
Enterprise IT environments involve various resources such as network devices, servers, operating systems, virtualization, databases, middleware, storage, and security devices. To achieve unified monitoring and alerting on a single platform, the key is full-stack access capability for all resource types. NI-System v7.0 uses a multi-protocol collection engine combining active polling and passive reception to collect 206 device types and 7,751 monitoring metrics in real time, ensuring every device and every critical metric is within monitoring scope.
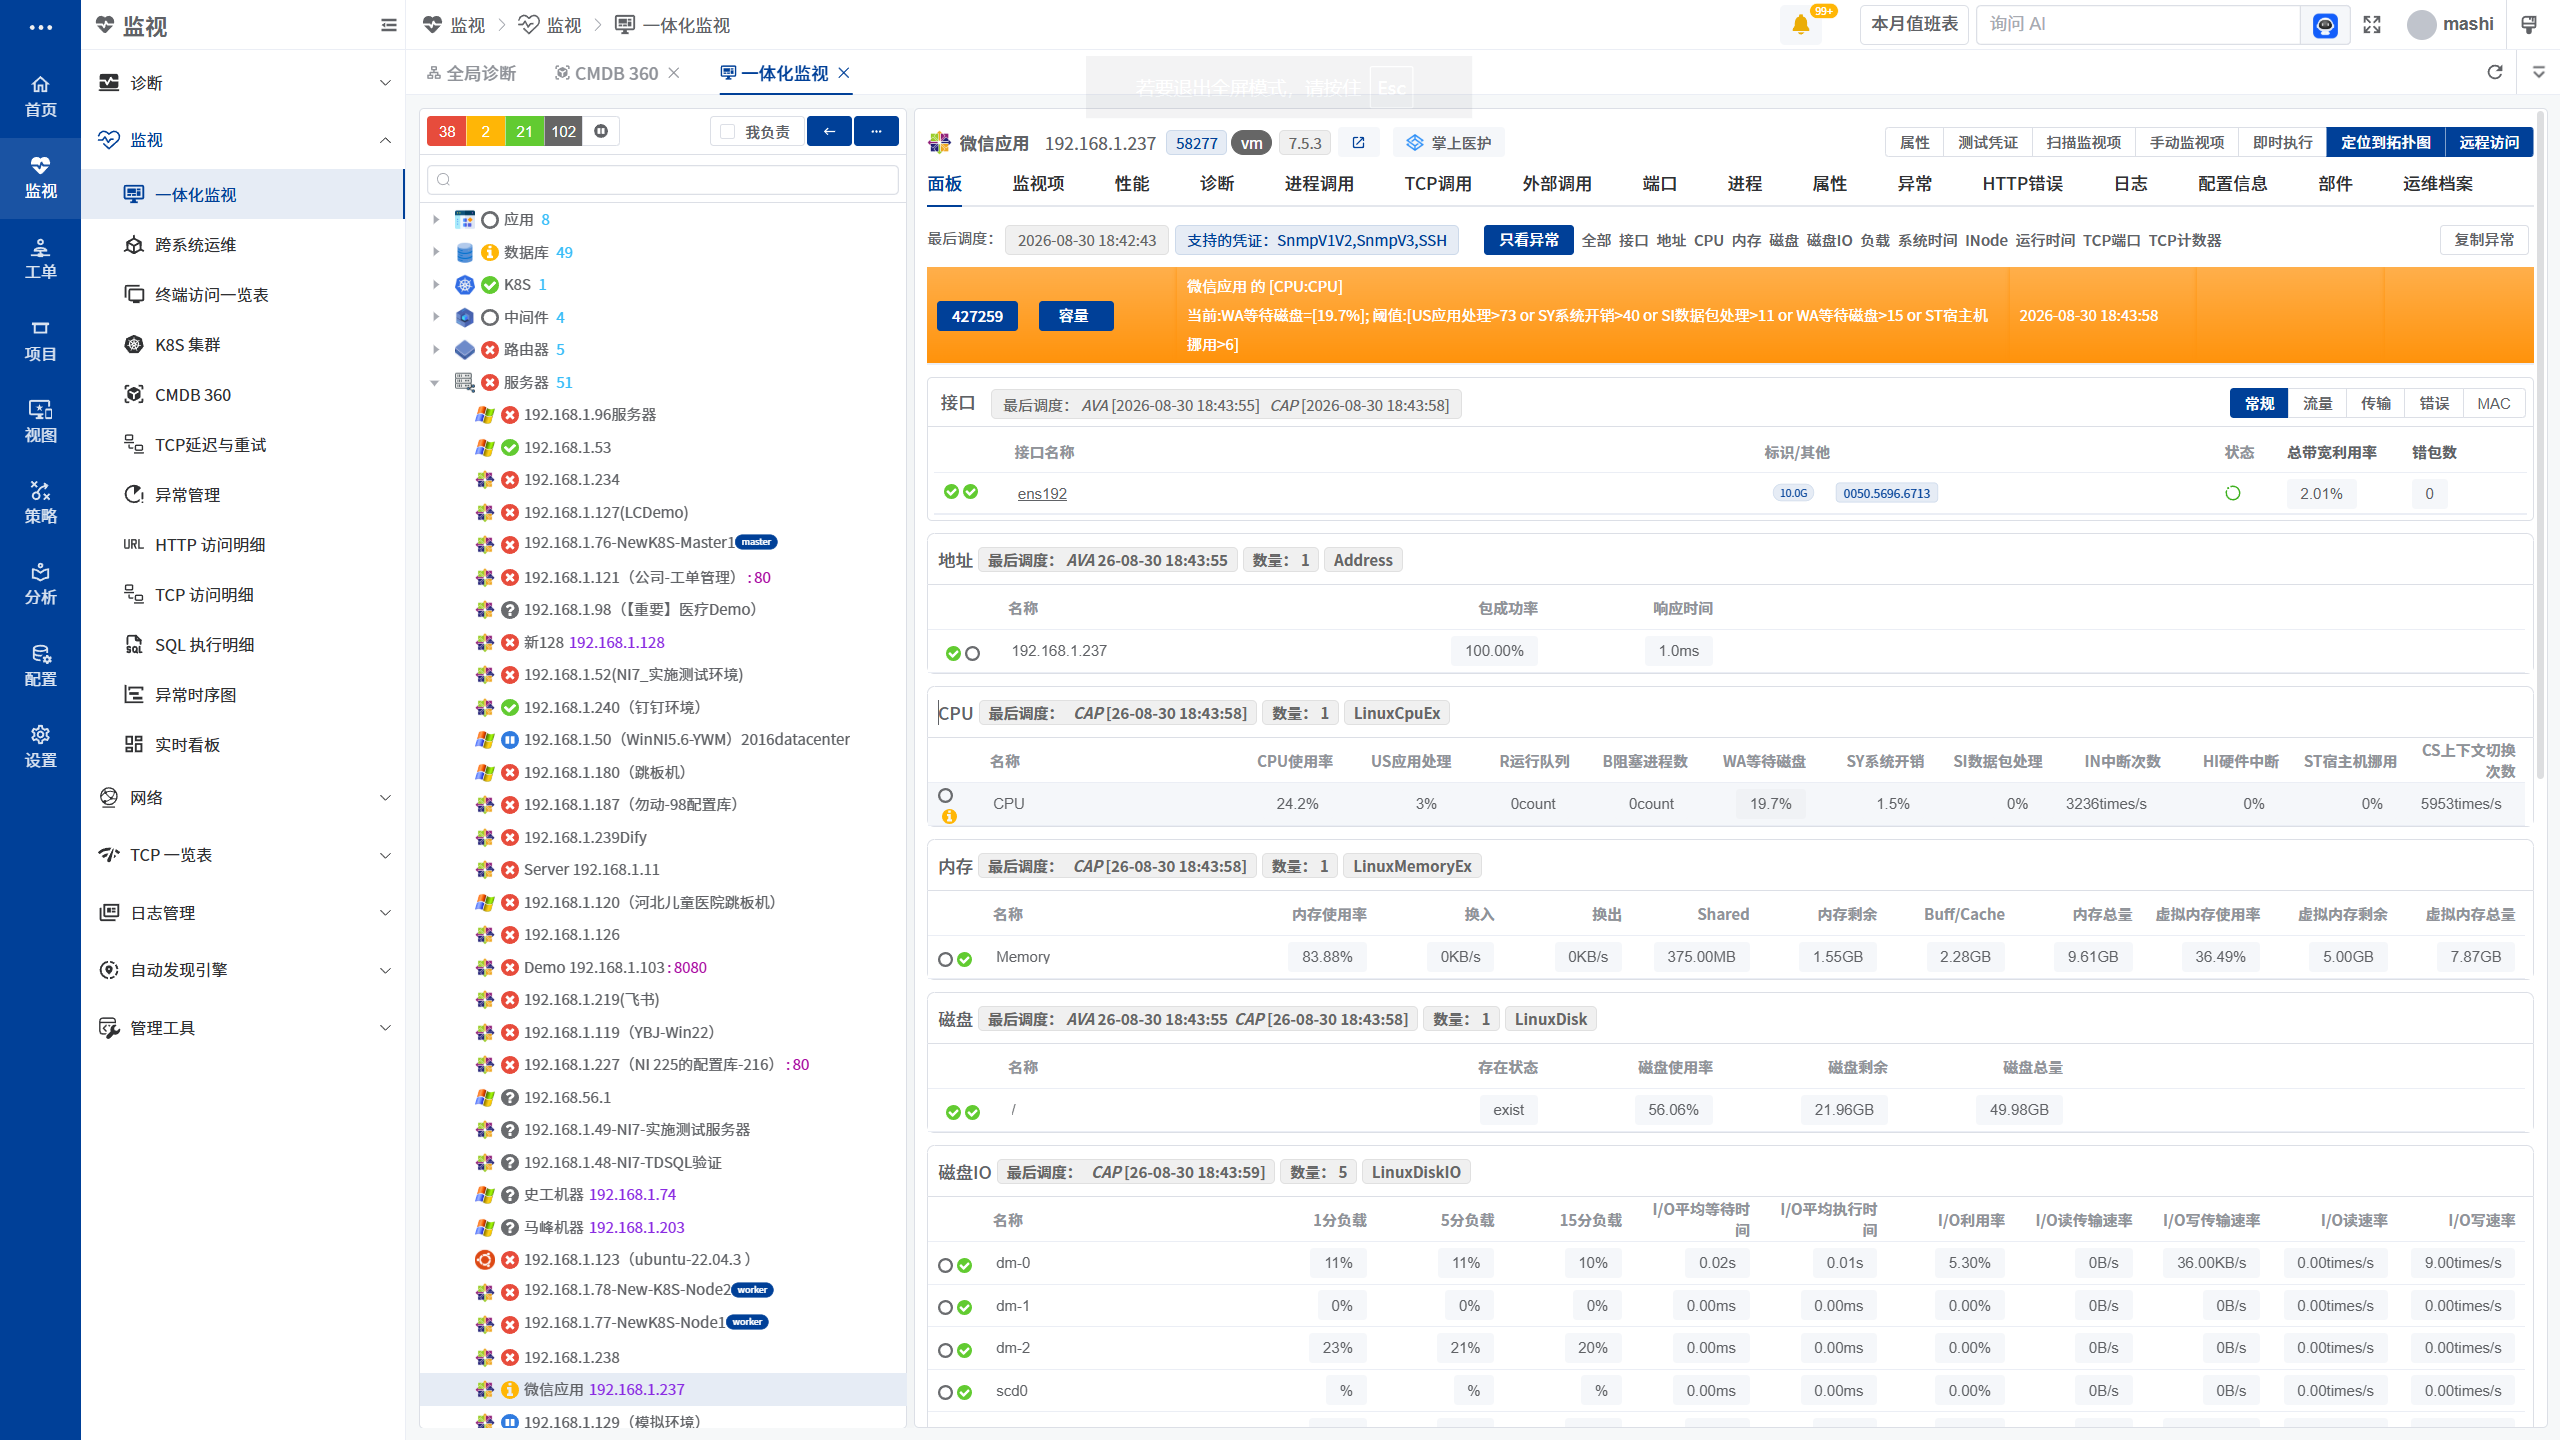
Multi-Protocol Collection Engine
Different vendors and device types provide different management interfaces. The collection engine has built-in support for multiple standard protocols, covering the entire technology stack from network layer to application layer with a single engine.
- Active Collection: Periodically polls device and application runtime status and performance metrics via standard management protocols, suitable for the vast majority of manageable devices
- Passive Reception: Supports events and logs proactively reported by devices, achieving event-level real-time awareness independent of polling cycles
- Traffic Analysis: Parses network traffic composition, identifying abnormal traffic, bandwidth bottlenecks, and port-level communication behavior
- Unified Data Model: Heterogeneous data collected by different protocols is normalized and stored/presented in a unified data model
Intelligent Alerting Engine
The purpose of monitoring is to detect problems promptly. The alerting engine performs rule matching and correlation analysis on massive collected data, transforming raw data into actionable operational events.
- Multi-Level Thresholds: Sets differentiated thresholds by severity, warning, and info levels, with different alerting strategies for different metrics
- Alert Convergence: Automatically merges duplicate alerts from the same incident source, suppresses alerts within maintenance windows, reducing noise
- Correlation Analysis: Combines dependency relationships in CMDB to correlate upstream and downstream incidents, locating root causes rather than symptoms
- Assignment & Escalation: Automatically assigns alerts to corresponding handlers by type and severity, with automatic escalation on timeout
Visualization & Reporting
Monitoring data serves not only real-time alerting but also trend analysis, capacity planning, and management decisions.
- Real-Time Status Dashboard: Visually presents overall IT environment health through topology maps, dashboards, etc.
- Performance Trend Charts: View metric historical trends by hour, day, week, month, etc., to gain insights into change patterns
- Alert Statistics Reports: Statistics of alert counts and handling status by device, severity, type, etc.
- Custom Reports: Flexibly customize monitoring reports and push them on schedule based on management needs
Supported Devices & Monitoring Metrics
Covers mainstream domestic and international vendors, including networks, hosts, virtualization, databases, middleware, storage, security devices and all IT infrastructure.
56 Network
86 Application
21 Operating System
20 Hardware
20 Storage
1 Environment
1 Other
1 Unknown
The above is the list of built-in supported device types and monitoring items, continuously updated. For devices outside the list, quick onboarding is available through custom collection templates.