End-to-End Monitoring & Analysis
Centered on business systems, all software and hardware performance data supporting the business is correlated and analyzed under a unified time dimension, helping ops teams quickly locate performance bottlenecks and potential risks from a business perspective. From user terminal access to backend database calls, full-chain response time distribution is tracked to answer the core question of "why is the business system slow."
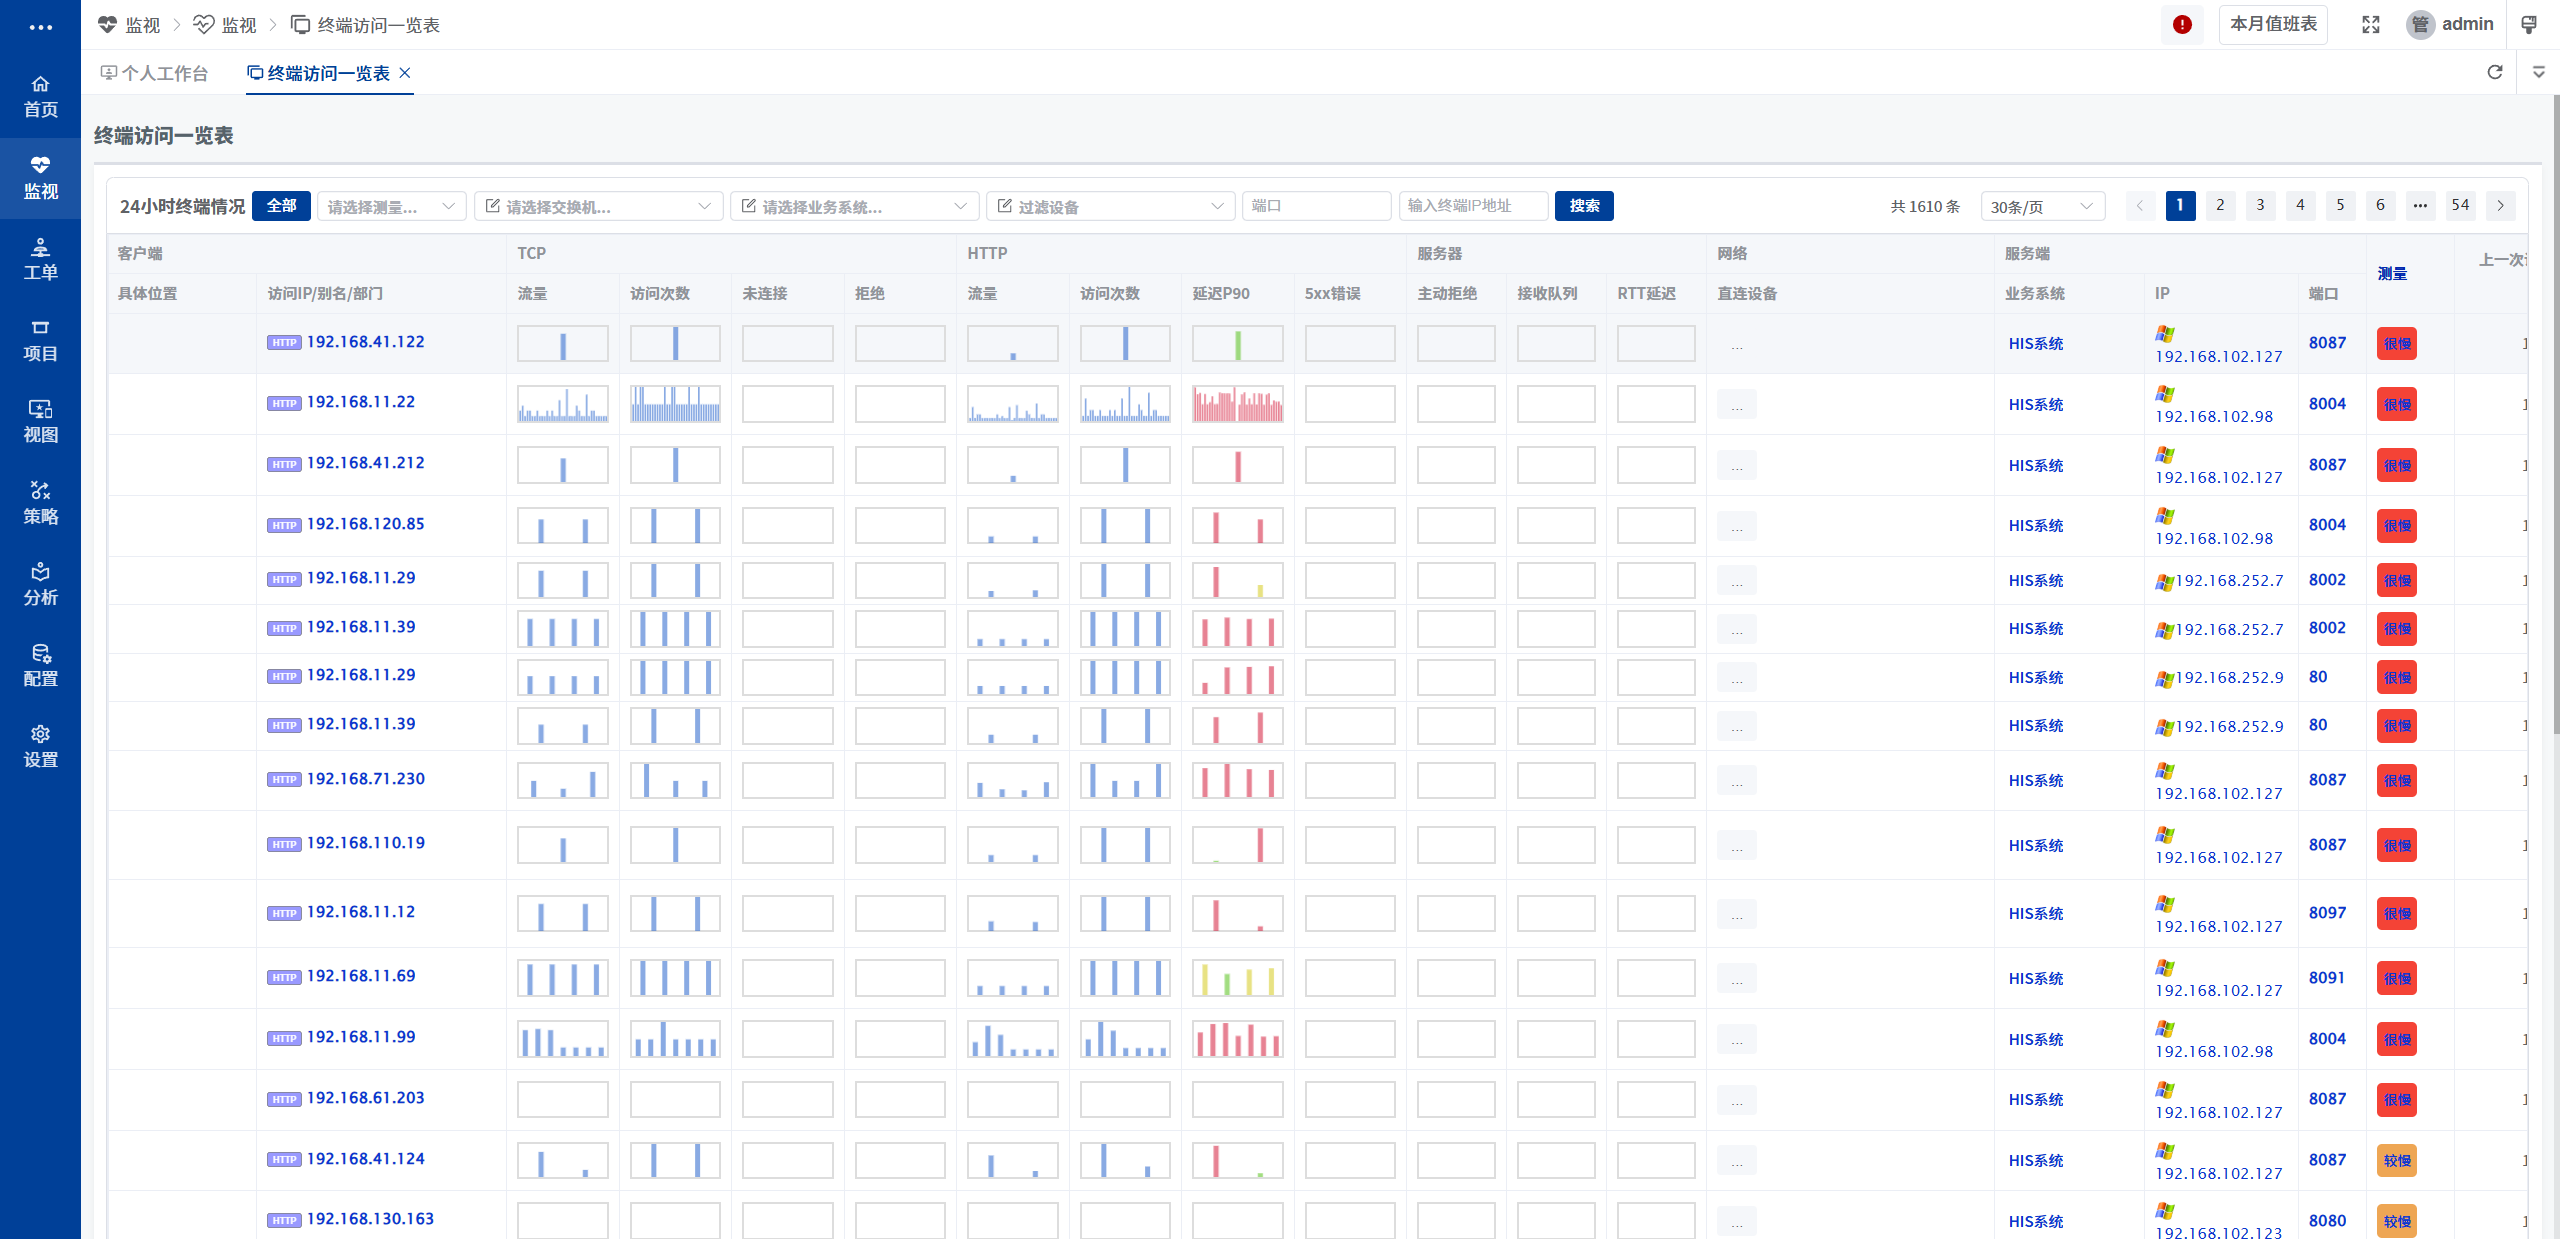
Business-Perspective Monitoring
The system organizes monitoring data around business systems rather than fragmenting by device type, keeping ops teams focused on business availability.
- Business System Modeling: Associates each business system with its dependent servers, databases, middleware, and network links
- Unified Time Dimension: Overlays performance metrics of all associated components on the same timeline for comparative analysis
- End-to-End Chain Tracing: Tracks response time distribution across the full chain from user request entry to backend database calls
- Business Health Scoring: Quantifies overall business system health by synthesizing component statuses
Correlation Analysis & Root Cause Localization
When business performance degrades, the system helps ops teams quickly locate the root cause through cross-layer data correlation, rather than checking devices one by one.
- Cross-Layer Data Correlation: Displays metrics from network, host, database, and application in a unified view
- Performance Bottleneck Localization: Identifies the true bottleneck by comparing component response times
- Risk Trend Prediction: Predicts resource usage trends based on historical data, detecting capacity risks early
- Root Cause Analysis Assistance: Recommends likely root cause devices and metrics based on configuration dependencies
Data Presentation & Reporting
Analysis results require clear presentation to be effectively communicated. The system provides business health dashboards, trend analysis reports, and other presentation forms.
- Business System Health Dashboard: Displays real-time health status and alerts for all business systems on one screen
- Performance Trend Charts: Customize time ranges and metric combinations to flexibly analyze performance changes
- Anomaly Alerting: Automatically alerts on abnormal deviations from baselines, shifting from reactive to proactive
- Capacity Analysis Reports: Periodically outputs capacity usage and trend reports to support expansion decisions
Application Value
End-to-end analysis from a business perspective aligns IT operations with business goals, enhancing business assurance capabilities.
- Quick Business Bottleneck Localization: Directly locate critical components affecting business instead of checking device by device
- Improved User Experience: Resolve performance risks before users perceive them through trend prediction
- Optimized Resource Investment: Capacity planning based on real load data avoids over- or under-provisioning
- Quantified IT Value: Business health data demonstrates IT operations' contribution to business assurance