NI-System v7.0 ITSM Feature Brief: Network Quality Monitoring
Network latency is the most comprehensive, sensitive, and trend-valuable metric. Hanyuan Wangzhi uses network latency as the primary metric for network troubleshooting. Only by prioritizing understanding of latency changes can we effectively identify hidden potential bottlenecks.
Latency Is the Core Standard of Network Quality
In a network, as long as there is slight congestion, performance degradation, or abnormal forwarding paths on a link, network latency will rise first, even before packet loss or traffic anomalies occur. This is because:
- The process of a data packet being forwarded by switches in a network involves all devices, links, forwarding tables, cache queues, and QoS policies along the path.
- Network traffic congestion, packet loss, optical fiber attenuation (optical loss), etc., are among the possible causes of latency increase, but they are not all of them.
Latency is the "result," while traffic, packet loss, and optical loss are "partial causes." Therefore, Hanyuan Wangzhi believes that the ability to provide stable, low-latency forwarding is the core standard of network quality.
When users report slow system access, if we only monitor whether network traffic, optical loss, and packet loss are abnormal and hastily conclude that "the network is normal," this is a one-sided and incomplete judgment.
Network Troubleshooting Process: "Latency First, Then Details"
Hanyuan Wangzhi's network troubleshooting process: "Latency first, then details" is the order of network diagnostic logic.
- End-to-end latency measurement → identify high-latency links/paths
- Investigate abnormal segments: traffic, packet loss, connectivity, CRC, etc.
- Locate root cause and optimize
1. Latency = Health Check Metric
First, measure whether end-to-end network latency is affected, especially whether there are fluctuations on critical business paths.
2. Define Troubleshooting Scope
Refine to the latency between each switch-to-switch segment to identify which segment of the network is "slowing down overall performance."
3. Packet Loss, Traffic, CRC, Connectivity = Cause Finding
Within the link segments with abnormal latency, further investigate:
- Whether there is optical loss
- Whether there is link packet loss
- Whether there are traffic bursts or bandwidth bottlenecks
Network latency is the most comprehensive, sensitive, and trend-valuable metric. Hanyuan Wangzhi uses network latency as the primary metric for network troubleshooting. Only by prioritizing understanding of latency changes can we effectively identify hidden potential bottlenecks in the network, and thereby conduct targeted deep troubleshooting and optimization.
How to Check Network Latency
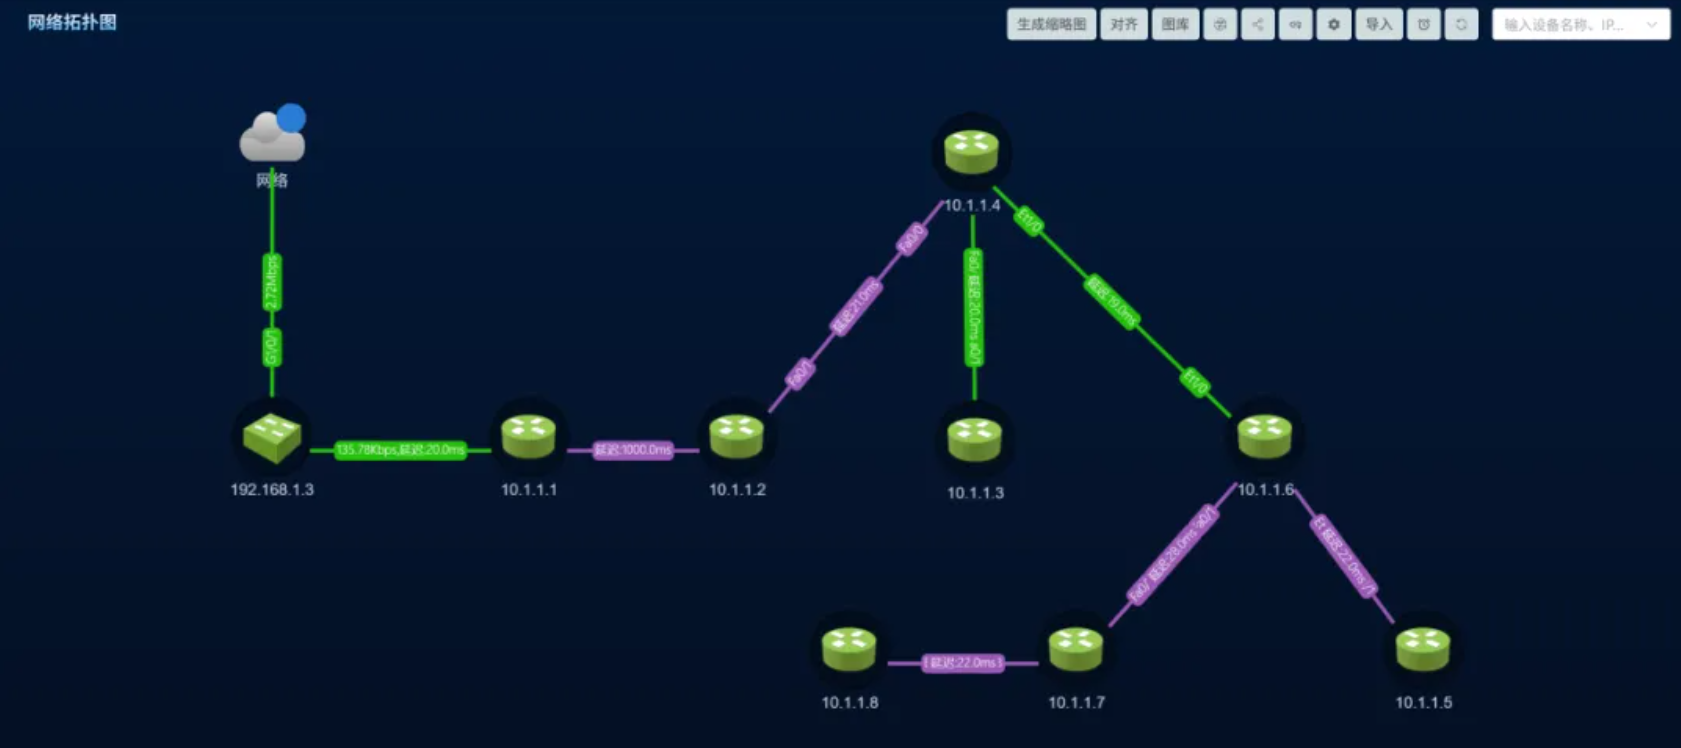
1. Draw the Topology Map
Auto-discover the topology map, manually draw if necessary, and select interfaces for connections between network devices.
2. Add NQA Link Monitor
Add NQA link monitoring items with one click in the unified monitoring module. The SNMP credentials of network devices need write permission; once credentials pass, monitoring works normally.
3. Set NQA Filter Conditions
Fill in the filter threshold under System Settings - NQA Filter Conditions. If left blank, the system default threshold is 50ms; links with latency above the threshold will be displayed on the business system dashboard.
Note: The network quality detection feature corresponds to NI-System v7.0 IT Operations System V7.1.32 and later versions.